The FIFA Paradox: Why We Spend 14 Hours Playing Games We Hate
⚠️ Disclaimer: Open Analysis
This post explores game data using statistical analysis. Please note that while I am an experienced engineer, I am not a specialized Data Scientist. I have made the code and data available in GitHub for transparency. If you find errors in the methodology or want to improve the model, I welcome your feedback and pull requests.
A Data Autopsy of the 'Casual' Gamer
Imagine a product.
It costs $70 a year. You don't just use it; you obsess over it. You spend nearly 15 hours, two full workdays, grinding away at it. It demands more of your time than any other form of entertainment you own.
And you hate almost every minute of it.
This isn't a theory. This is what the data says.
We tend to dismiss Shooters and Sports games ("Gun and Ball") as the fast food of the gaming industry, soulless, low-quality trash consumed by "casuals" who don't know any better. But we don't trust stereotypes. We trust cold, hard numbers. (and that's a fact.)
So, I built a custom data pipeline to ingest over 24,000 video games, filter the noise, and force the industry's biggest genres to face the music.
I expected to find that mainstream games were "dumb fun". Instead, I found a statistical tragedy. I found that while Shooter fans are having a blast, Sports fans are stuck in a proven, quantifiable loop of addiction and dissatisfaction I call "The Misery Index".
Here is the code, the charts, and the proof.
1. The Engineering: Building the Ingestion Engine
I didn't want a static Kaggle CSV snapshot. I wanted a live, reproducible look at the market. I built an ETL (Extract, Transform, Load) pipeline using modern Python tooling to handle the massive amount of data required for statistical significance.
The Stack
- Environment:
uv(for lightning-fast Rust-based dependency management). - Source: The RAWG.io API (the largest open video game database).
- Storage: Local CSV Data Lake (treating network calls as expensive and disk as cheap).
The Pipeline Strategy
I designed an ingestion script designed for robustness and respect for API quotas.
- Targeting the "Big 8" Archetypes: Instead of vague genres like "Action," I targeted specific behavioral archetypes: Shooter (Gun), Sports (Ball), RPG (Sword), Strategy (Brain), Indie (Soul), etc.
- Rate-Limited Pagination: iterated through thousands of pages of API results, implementing sleep timers to handle rate limits gracefully.
- Idempotent Storage: The system checks against existing records by ID to prevent duplicate entries, allowing me to stop and restart ingestion without corrupting the dataset.
The result was a 3MB raw dataset containing over 24,000 unique games, ready for analysis.
2. The Data Science: Filtering the Noise
Raw data is never ready for insights. My initial ingestion included thousands of unreleased games, prototypes, and "shovelware" with zero playtime. Including these would pollute our analysis of actual gamer behavior.
The "True Gamer" Filter
I applied a filter to create our analysis cohort. Only included games where:
Playtime > 0(Someone has actually played it).Metacritic is not Null(There is critical consensus on its quality).
This reduced the dataset to the games that actually matter, the ones people are spending their lives on.
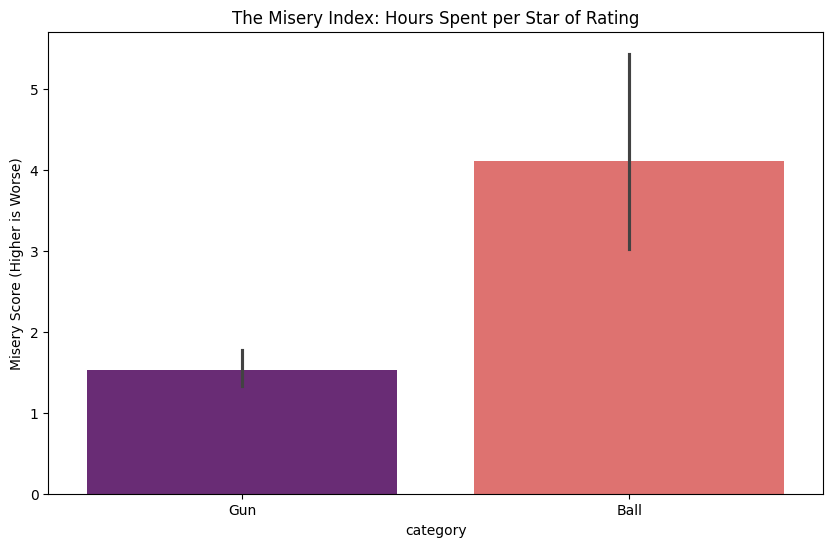
Feature Engineering: The "Misery Index"
Beyond standard metrics like Metascore and Playtime, I needed a way to quantify the relationship between engagement and satisfaction.
So, engineered a new feature: The Misery Index.
- Low Index: You play a moderate amount and love it (Healthy).
- High Index: You play a massive amount but rate it poorly (Toxic/Addictive).
Note: Games with a User Rating of 0 (Unrated) were excluded from the Misery Index to prevent division-by-zero errors. I calculate the index only for games that have both active players and active user sentiment.
3. Findings, Deductions, and Results
I broke my analysis into two distinct phases:
- Phase A: The Mainstream Myth (Comparing Shooters & Sports against the rest of the gaming world).
- Phase B: The Civil War (Comparing Shooters directly against Sports).
Phase A: The "Jock vs. Nerd" Stereotype Is Dead
The data immediately shattered the two biggest myths about mainstream gaming.
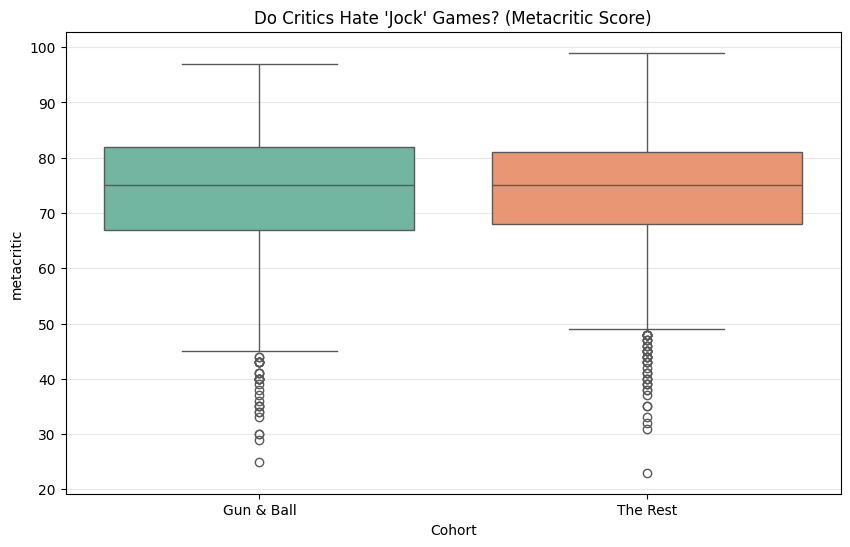
Myth 1: Critics hate "dumb" mainstream games.
False. When I looked at the average critical scores, there was statistically zero difference. Critics judge execution, not genre.
| Cohort | Average Metascore |
|---|---|
| Gun & Ball | 73.22 |
| The Rest (RPGs, Indie, etc.) | 73.89 |
As the boxplot below shows, the distribution of quality is almost identical. The "quality ceiling" for a great shooter is just as high as a great RPG.
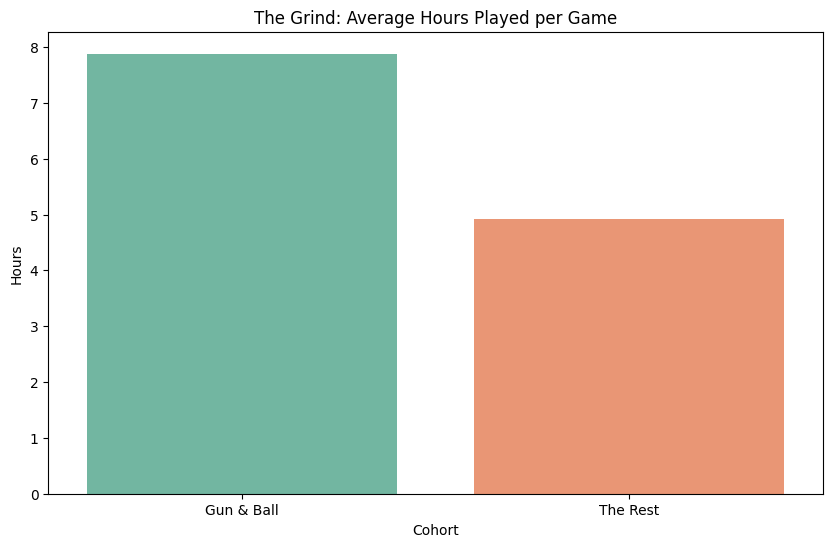
Myth 2: Mainstream gamers are "Casuals."
False. This was the biggest shock. "Gun & Ball" players are not casuals; they are the most dedicated grinders in the industry.
| Cohort | Average Hours Played |
|---|---|
| Gun & Ball | 7.88 Hours |
| The Rest | 4.91 Hours |
Mainstream gamers play nearly 60% longer per game than fans of narrative genres. The industry pivot to "Live Service" wasn't an accident; it was a response to this data.
Phase B: The Civil War (The FIFA Paradox)
When I grouped Shooters and Sports together, they looked healthy. But when I split them apart, a tragic story emerged. They are not the same.
The Tale of the Tape
| Metric | Gun (Shooter) | Ball (Sports) | The Winner |
|---|---|---|---|
| Popularity (Avg Ratings Count) | 514 | 117 | Gun (Cultural Dominance) |
| Quality (Metascore) | 72.98 | 73.85 | Ball (Marginally) |
| Addiction (Avg Playtime) | 5.50 Hours | 14.23 Hours | Ball (Massive Grind) |
| Happiness (User Rating 0-5) | 3.38 | 2.93 | Gun (Soul intact) |
The Deduction: The Misery Loop
Shooter players act like "Tourists", they come in huge numbers, play a moderate amount (5.5 hours), have fun (3.38 rating), and leave.
Sports players act like "Hostages". They have the highest retention in the industry (14.23 hours average) but the lowest satisfaction (2.93 rating). It is the only major genre with an average user rating below 3.0.
This is visualized perfectly by the Misery Index:
The "Quadrant of Misery"
To fully understand the scale of this anomaly, I plotted every game in the dataset on a 2D plane.
- X-Axis (Addiction): Hours Played. Further right means more grinding.
- Y-Axis (Quality): Metacritic Score. Higher means better critical reception.
Most genres cluster in the top-left (High Quality, Moderate Playtime). Great RPGs and Strategy games sit high up, respected but finished in a reasonable time.
But look at the Orange Xs (Sports Games).
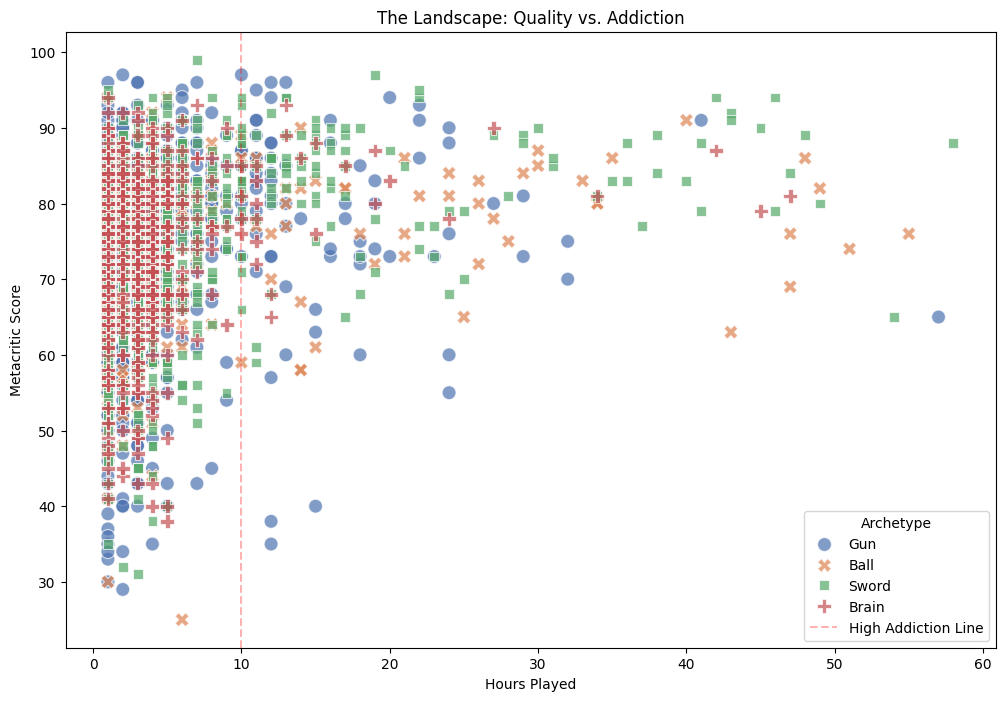
They form a distinct tail stretching into the bottom-right corner. This is the Quadrant of Misery.
While other genres usually see a correlation between quality and playtime (people play good games longer), Sports games break the correlation. You can see titles with mediocre scores (60–70) that command massive playtime (40+ hours). This visualizes the "captive audience" effect: players aren't staying because the game is a masterpiece; they are staying because there is no alternative.
4. The Questions We Asked (And The Answers Data Gave)
I started this project with 7 specific questions. Here are the definitive answers based on the data.
Q1: Do G&B games perform better than other genres (critically)? No. As seen in Figure 1, they are statistically average. They perform roughly the same as RPGs and Strategy games on Metacritic (approx. 73/100).
Q2: Are G&B players casual players? Absolutely not. As shown in Figure 2, they play significantly more hours per game than the rest of the gaming population. They are "Hardcore Grinders".
Q3: Are G&B games soulless? (User Rating) Sports games are; Shooters are not. Shooters maintain a healthy user rating (3.38/5). Sports games have the lowest user satisfaction in the industry (2.93/5).
Q4: Do G&B games make more money than others? Yes. They have significantly higher rating counts (514 vs ~60), indicating massive install bases and sales volume compared to niche genres. (Let's not forget about microtransactions, yuck.)
Q5: Are G&B games better than other genres? No. They lose on user satisfaction and tie on critical quality. They are not "better" by any qualitative metric; they are simply "stickier".
Q6: Are G&B games played more than other genres? Yes, by a wide margin. They are nearly 60% more effective at retaining player attention than the average game, as proven by the Figure 2 playtime gap.
Q7: What are common specs of people playing G&B games? Figure 4 reveals two distinct profiles:
- The Shooter player is a "Grazer", high volume of games, moderate playtime per game (Blue circles in the top-left).
- The Sports player is a "Specialist", low volume of games, massive investment of time into a single annual title they hate (Orange Xs in the bottom-right).
You can check the project here: Project Touch Grass